SSDA Announces Data Visualization Winners
September 20, 2019 - ssda@msu.edu
In the 2019 SSDA Data Visualization Challenge, we received a total of 13 entrees from a wide range of fields and topics. Three faculty judges evaluated every visualization based on a three-part rubric that considered communication effectiveness, creativity, and design. We appreciate the time and energy they put into these assessments. The judges' tasks were made difficult given the high quality and diverse approaches and topics of the submitted work. Now, we are excited to announce the winners.
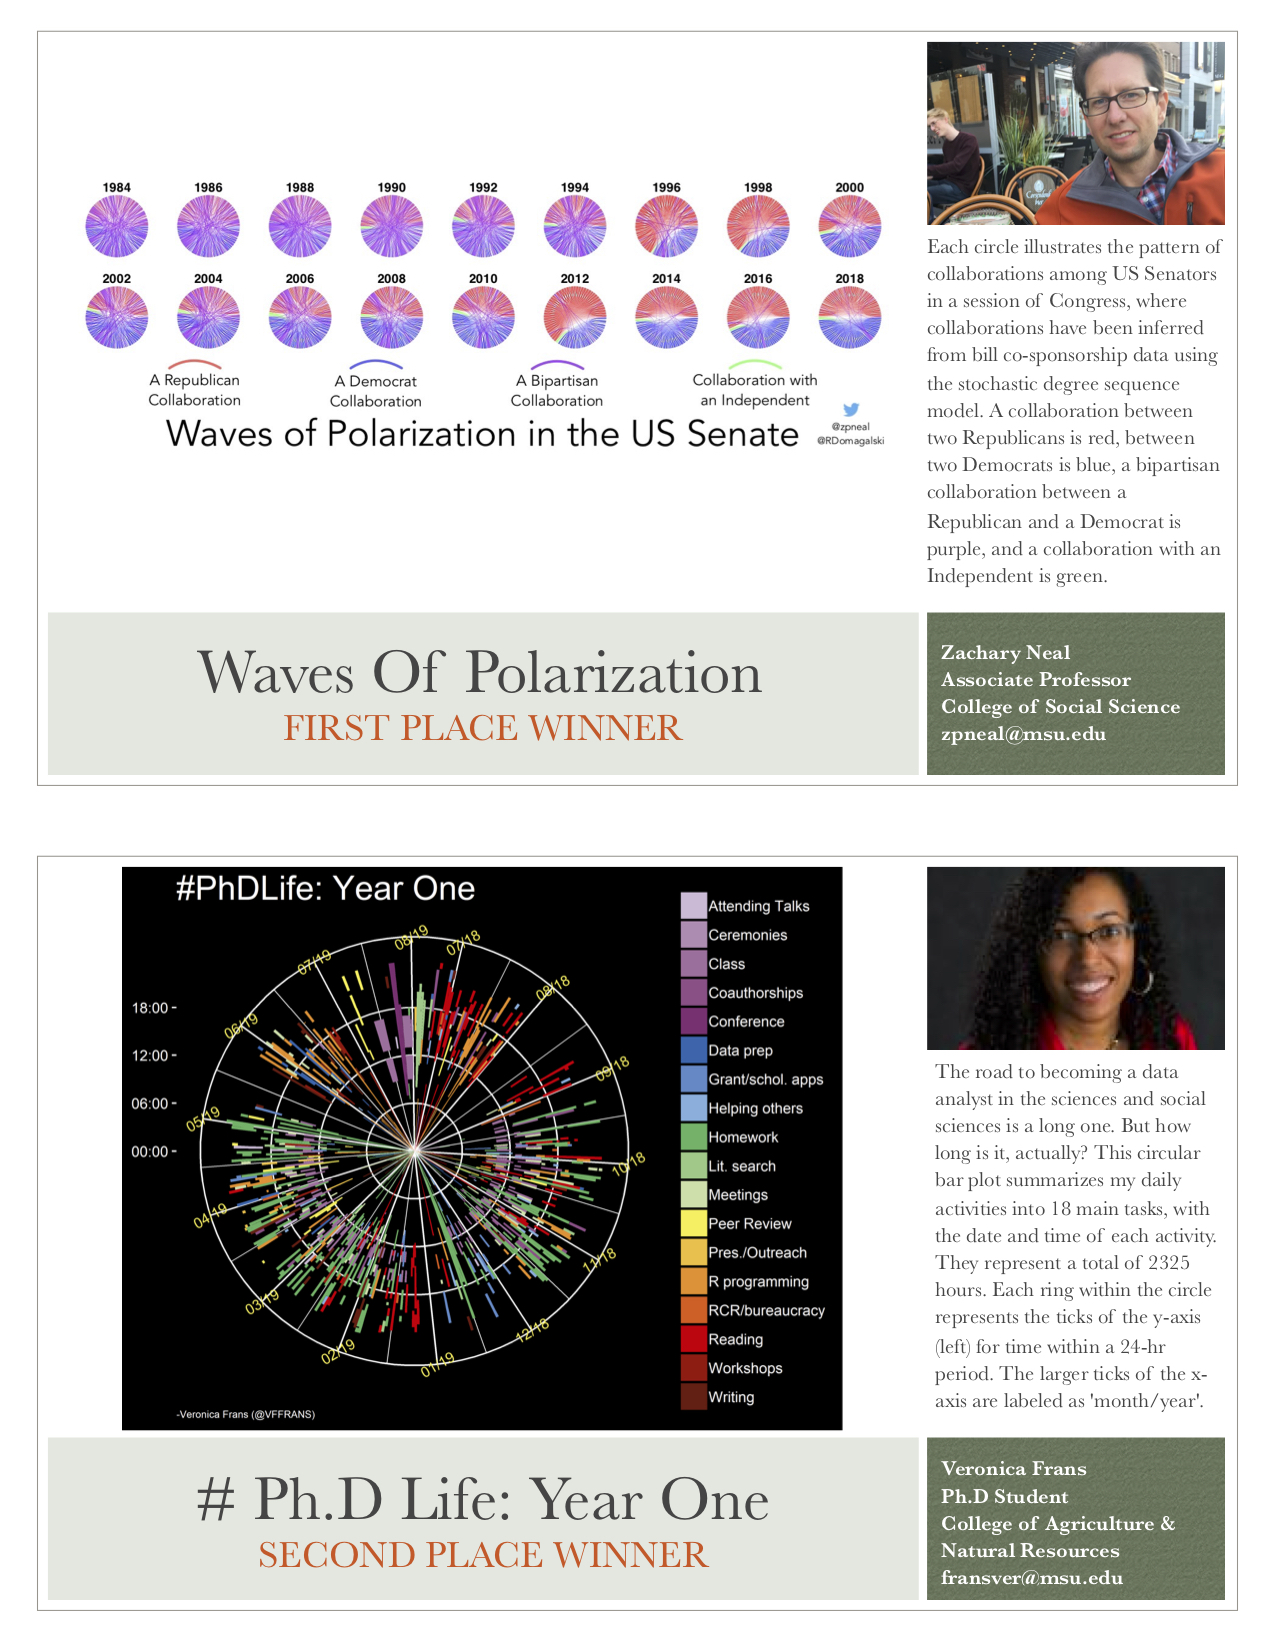
FIRST PLACE goes to Dr. Zachary Neal, for "Waves of Polarization in the US Senate". This graphic effectively captured changes in the degree of bipartisanship for sponsored bills in the Senate from 1984-2018.
SECOND PLACE is a tie between two strong visualizations:
- Veronica Frans for her introspective "# Ph.D. Life: Year One", detailing her use of time on academic work over her first year at MSU.
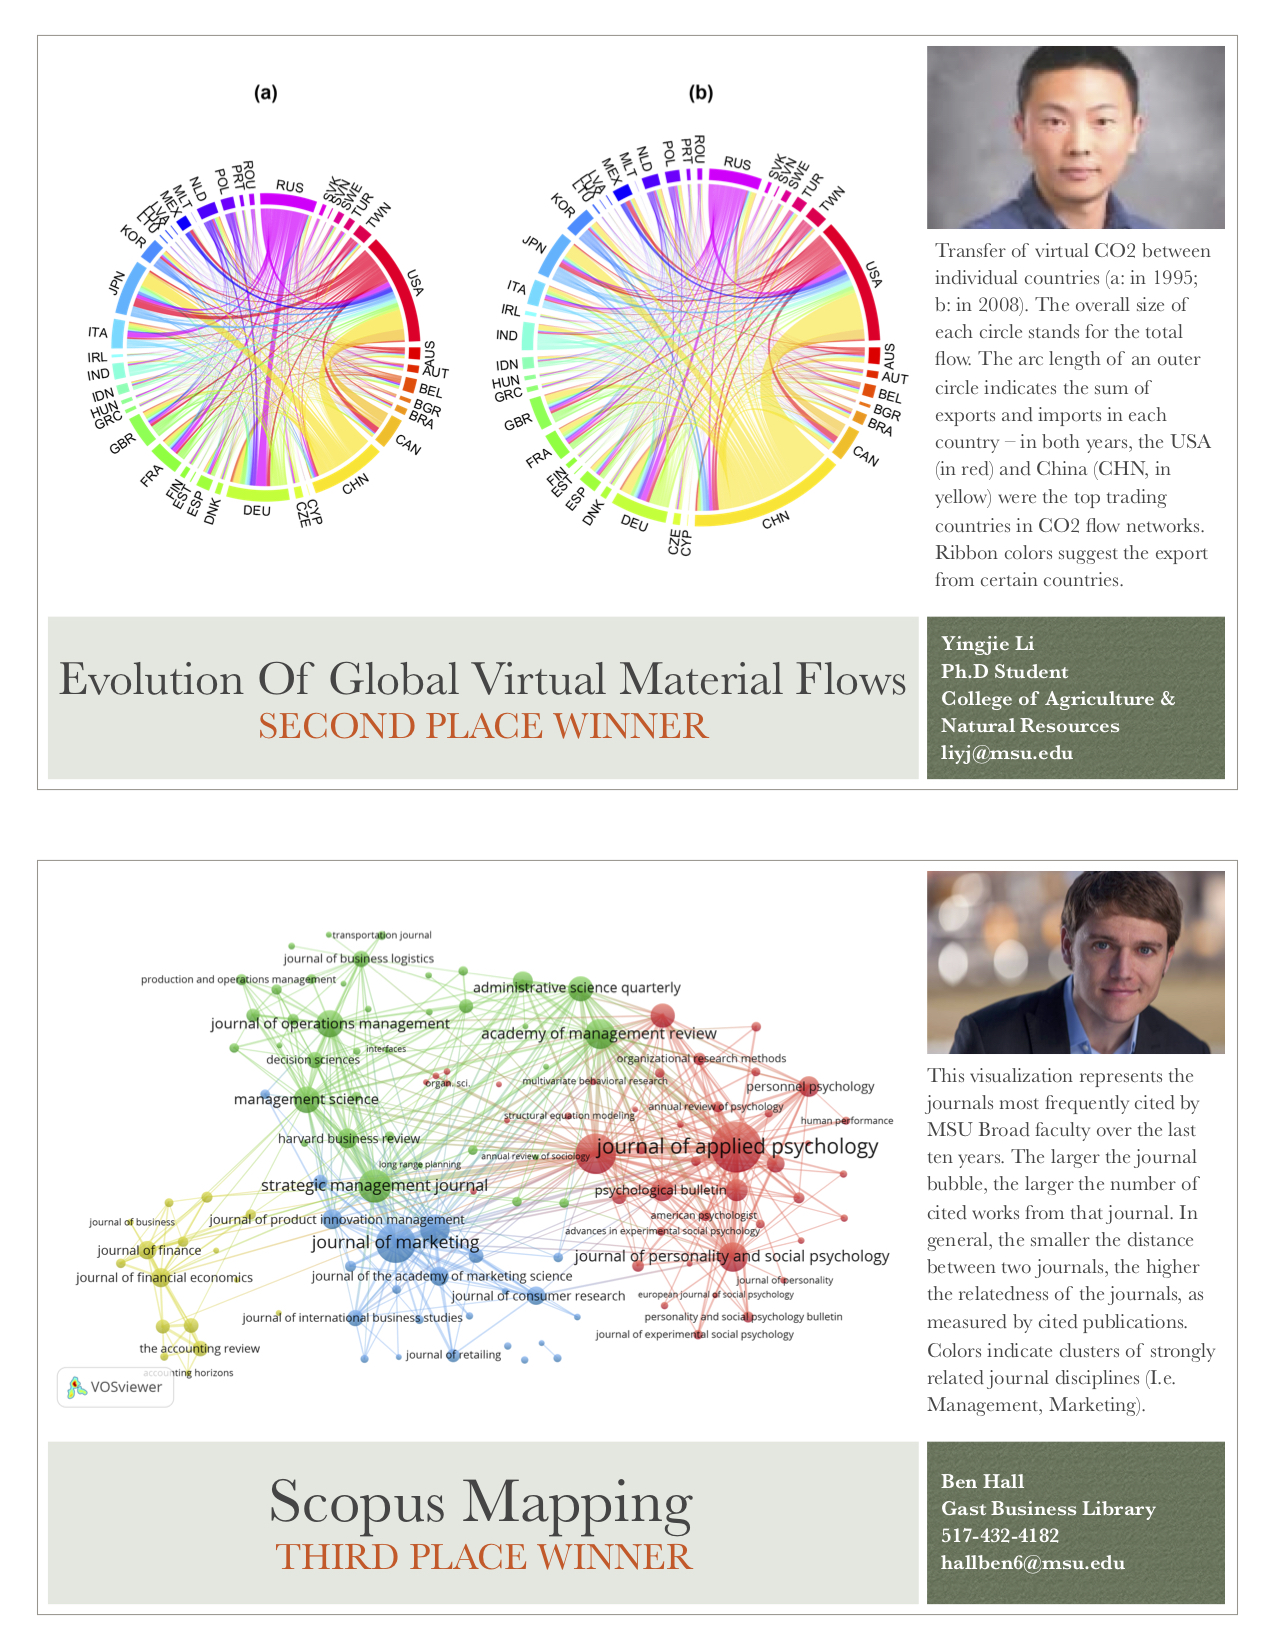
- Yingjie Li for "Evolution of Global Virtual Material Flows", a graphic capturing magnitudes and changes in CO2 flows between major trading countries.
THIRD PLACE goes to Ben Hall, for his “Scopus Mapping”, a visualization based on MSU data!
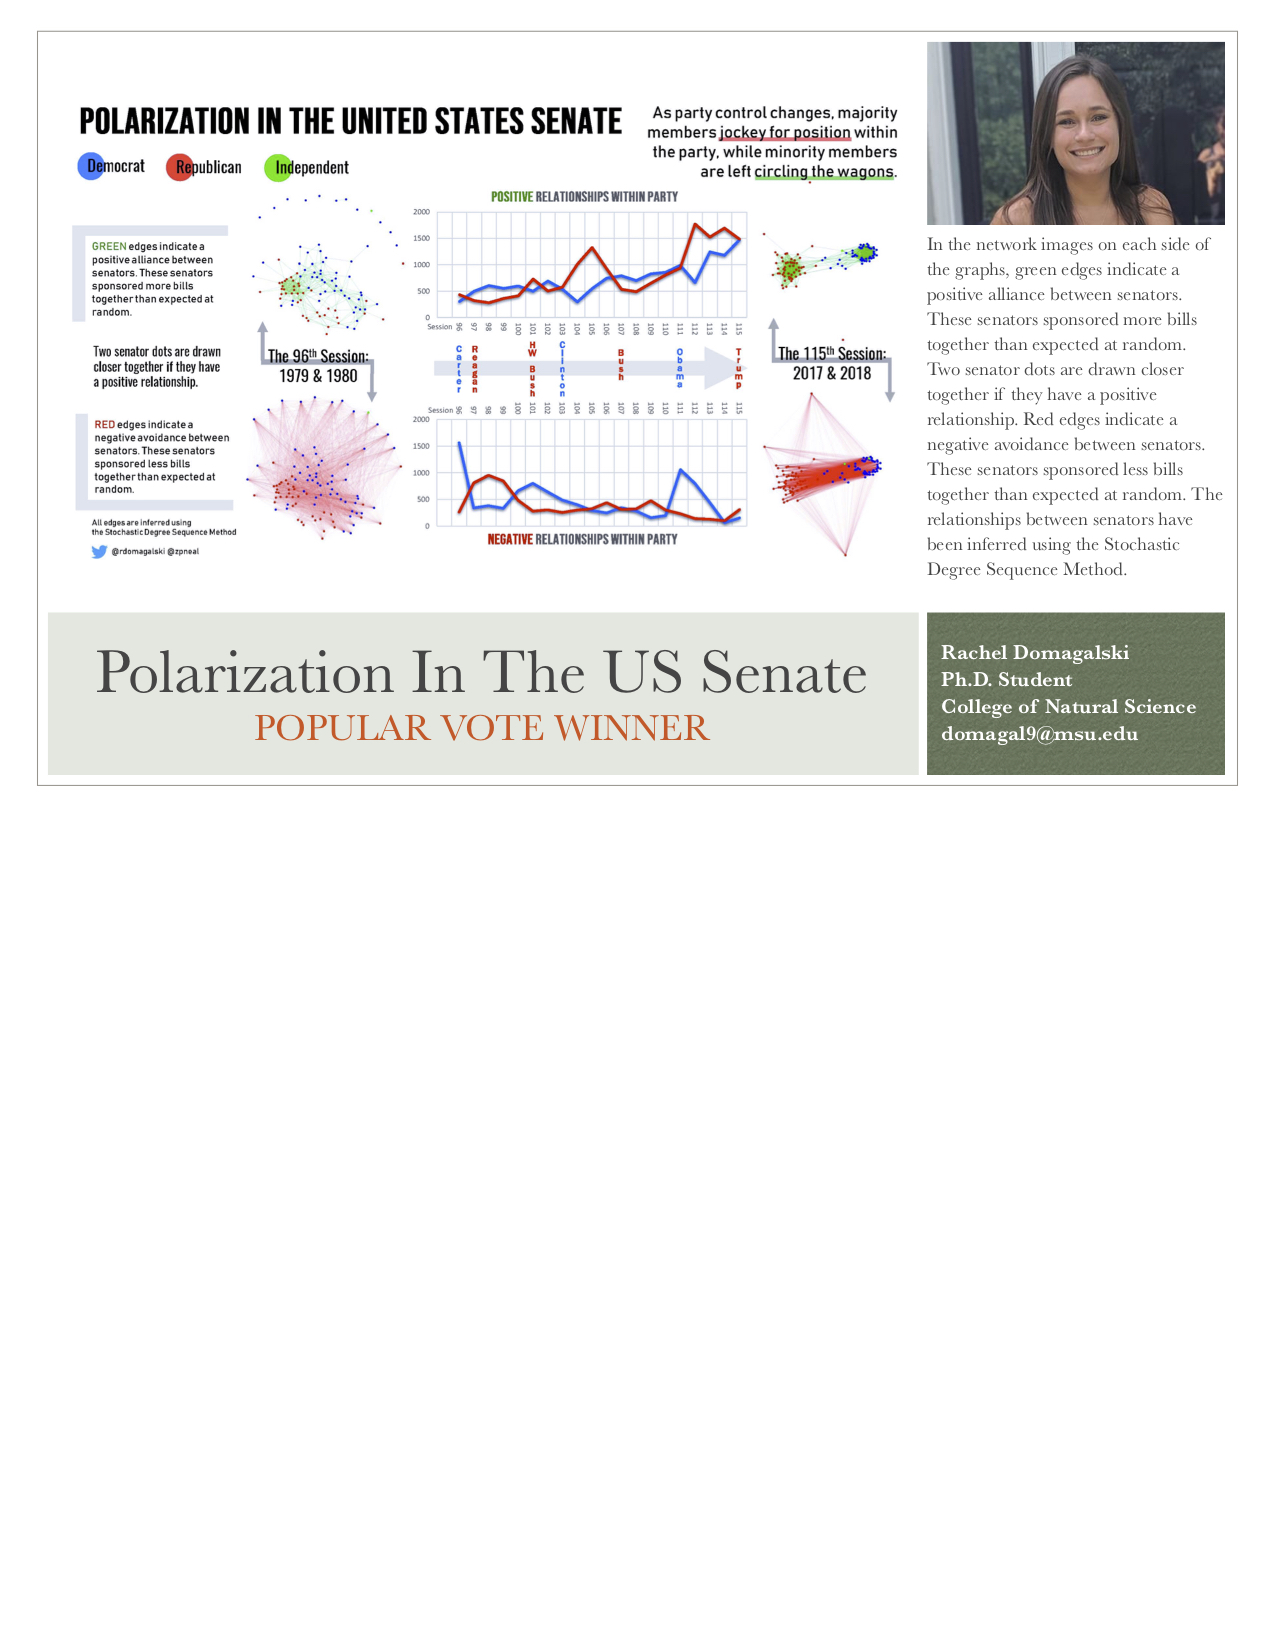
Please also join me to congratulate, Rachal Domagalski, our POPULAR VOTE winner, for her “Polarization in the US Senate”, which draw almost 30% of the total popular vote!
Congratulations to all the winners!