SSDA Special Workshop Series II.2.S2: Data Visualization in R
Tue, June 25, 2019 1:00 PM - Tue, June 25, 2019 4:00 PM at Nisbet Building, Suite 320, Michigan State University
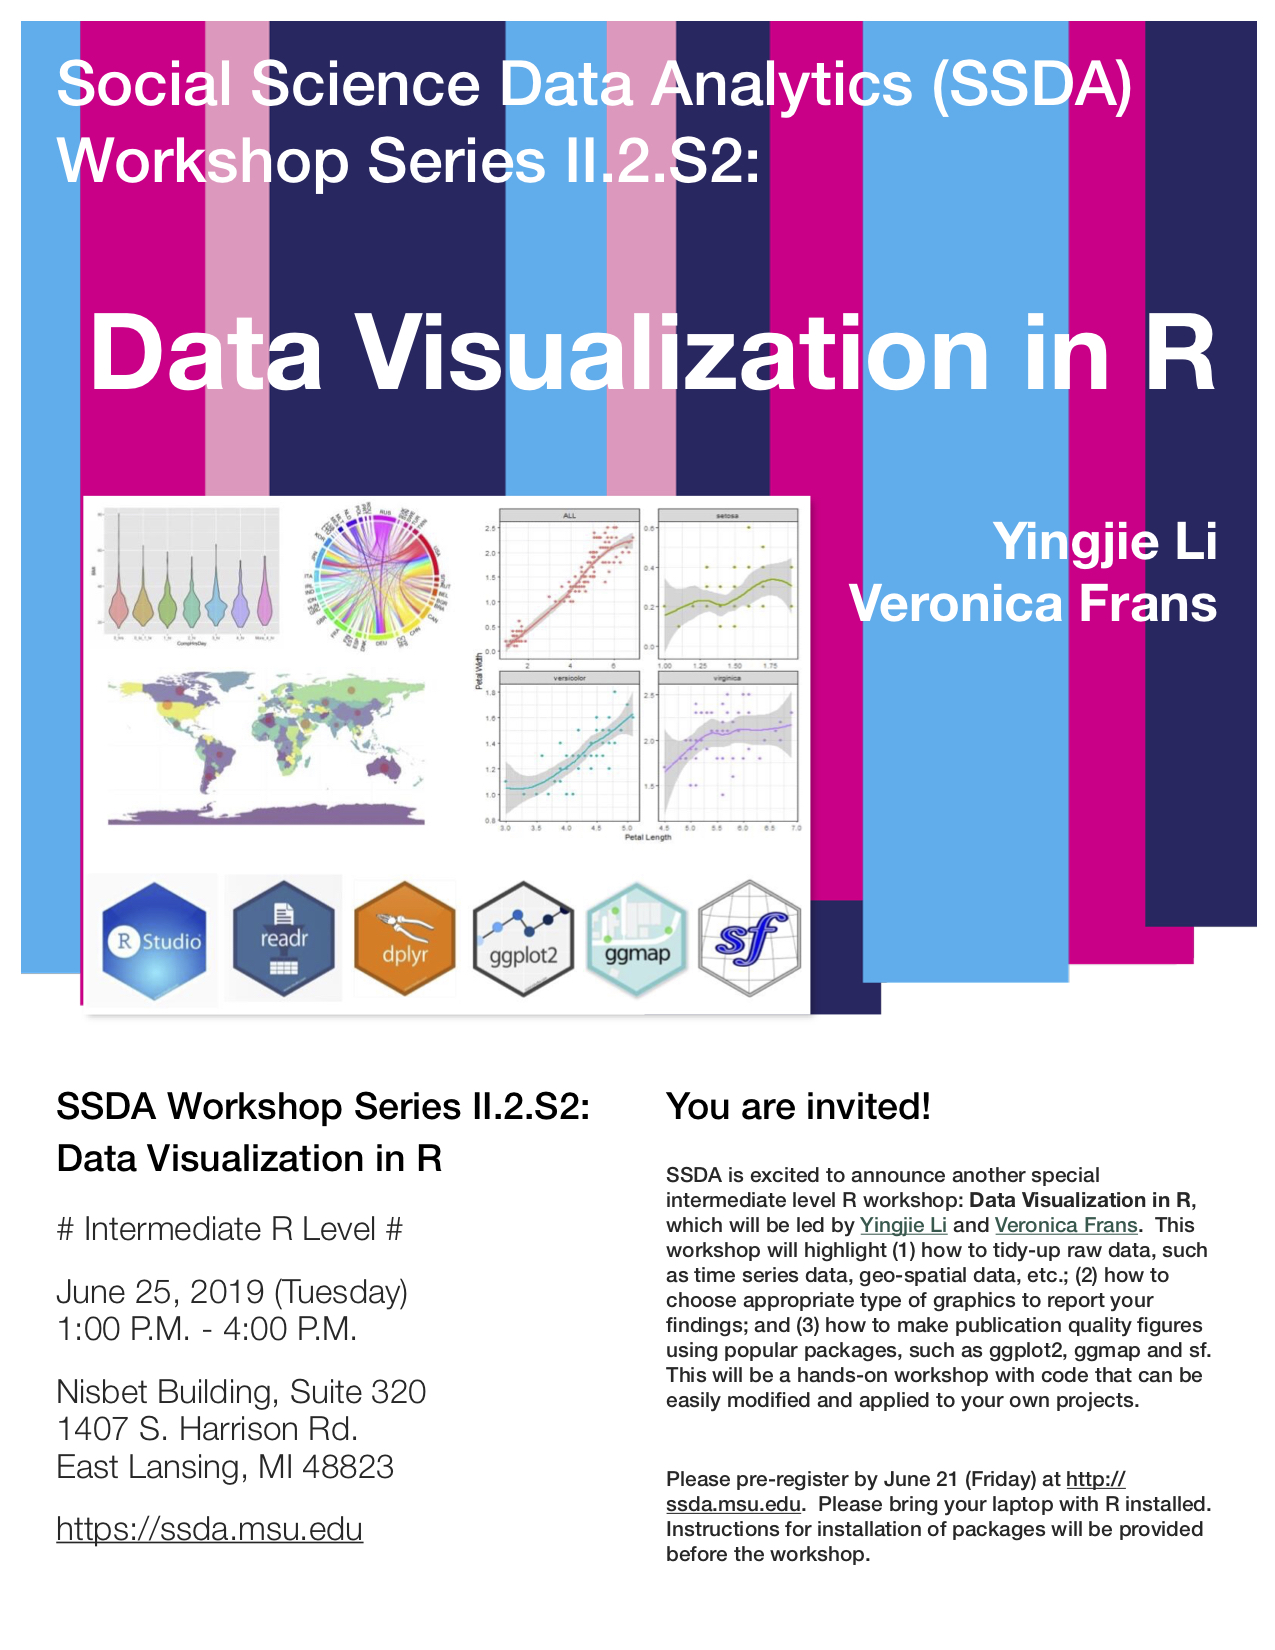
SSDA is excited to announce another special intermediate level workshop: Data Visualization in R, which will be led by Yingjie Li and Veronica Frans. This workshop will highlight (1) how to tidy-up raw data, such as time series data, geo-spatial data, etc., (2) how to choose the appropriate type of graphic to report your findings, and (3) how to make publication quality figures using popular packages, such as ggplot2, ggmap and sf. This will be a hands-on workshop with code that can be easily modified and applied to your own projects.
# This is an intermediate R level workshop #
- Time: 1:00 P.M. - 4:00 P.M., June 25, 2019 (Tuesday)
- Location: Suite 320, Nisbet building
- Registration: closed for this event
- Parking: Both meter parking and permit parking available
- Bring: Please bring your laptop with R installed. Windows users should also install RStudio. Instructions for installation of packages will be provided before the workshop.
- Welcome to join our SSDA mailing list!